前言
本文源码大部分是采用的OpenCV实战(一)——简单的车牌识别这篇文章所提供的代码,对其代码进行了整合,追加了HSV、tesseract-OCR等内容。大佬文章中有对其步骤的详细讲解和分析,本文只是在原有基础上,进行了拓展和改造,细节内容可直接参考大佬的博文。由于大佬没有提供完整项目和模型,我这进行了自己简单的数据集构建和模型训练。
Windows tesseract-OCR 的安装和简单测试
ps:所有图片素材均源自网络,如果侵权可私信,立删。
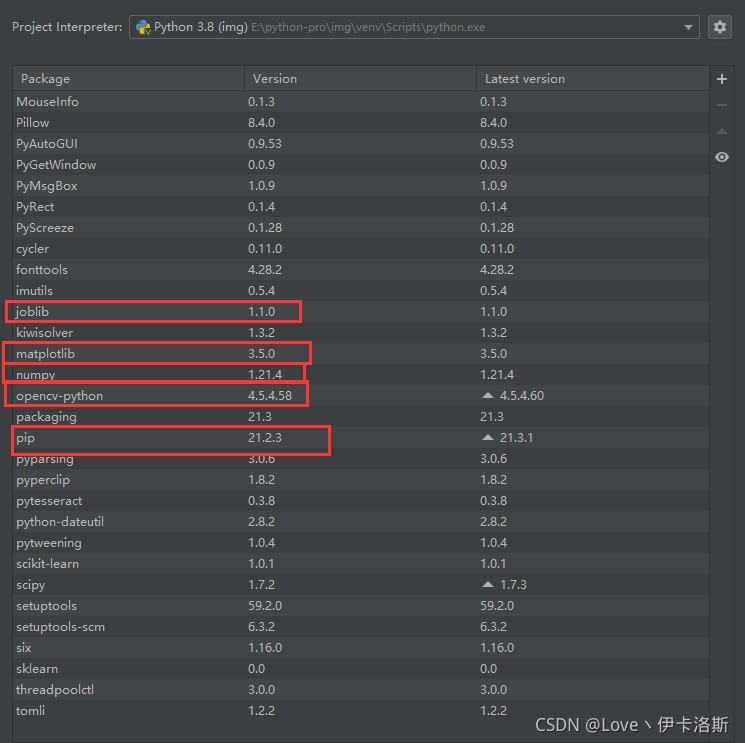
开发环境:
- pycharm-2020
- python-3.8.5
- opencv-python-4.5.4.58
- matplotlib-3.5.0
- pip-21.2.3
- Tesseract-OCR-5.0.0
- numpy-1.21.4
- sklearn-0.0.0
- joblib-1.1.0
工程下载
码云 github
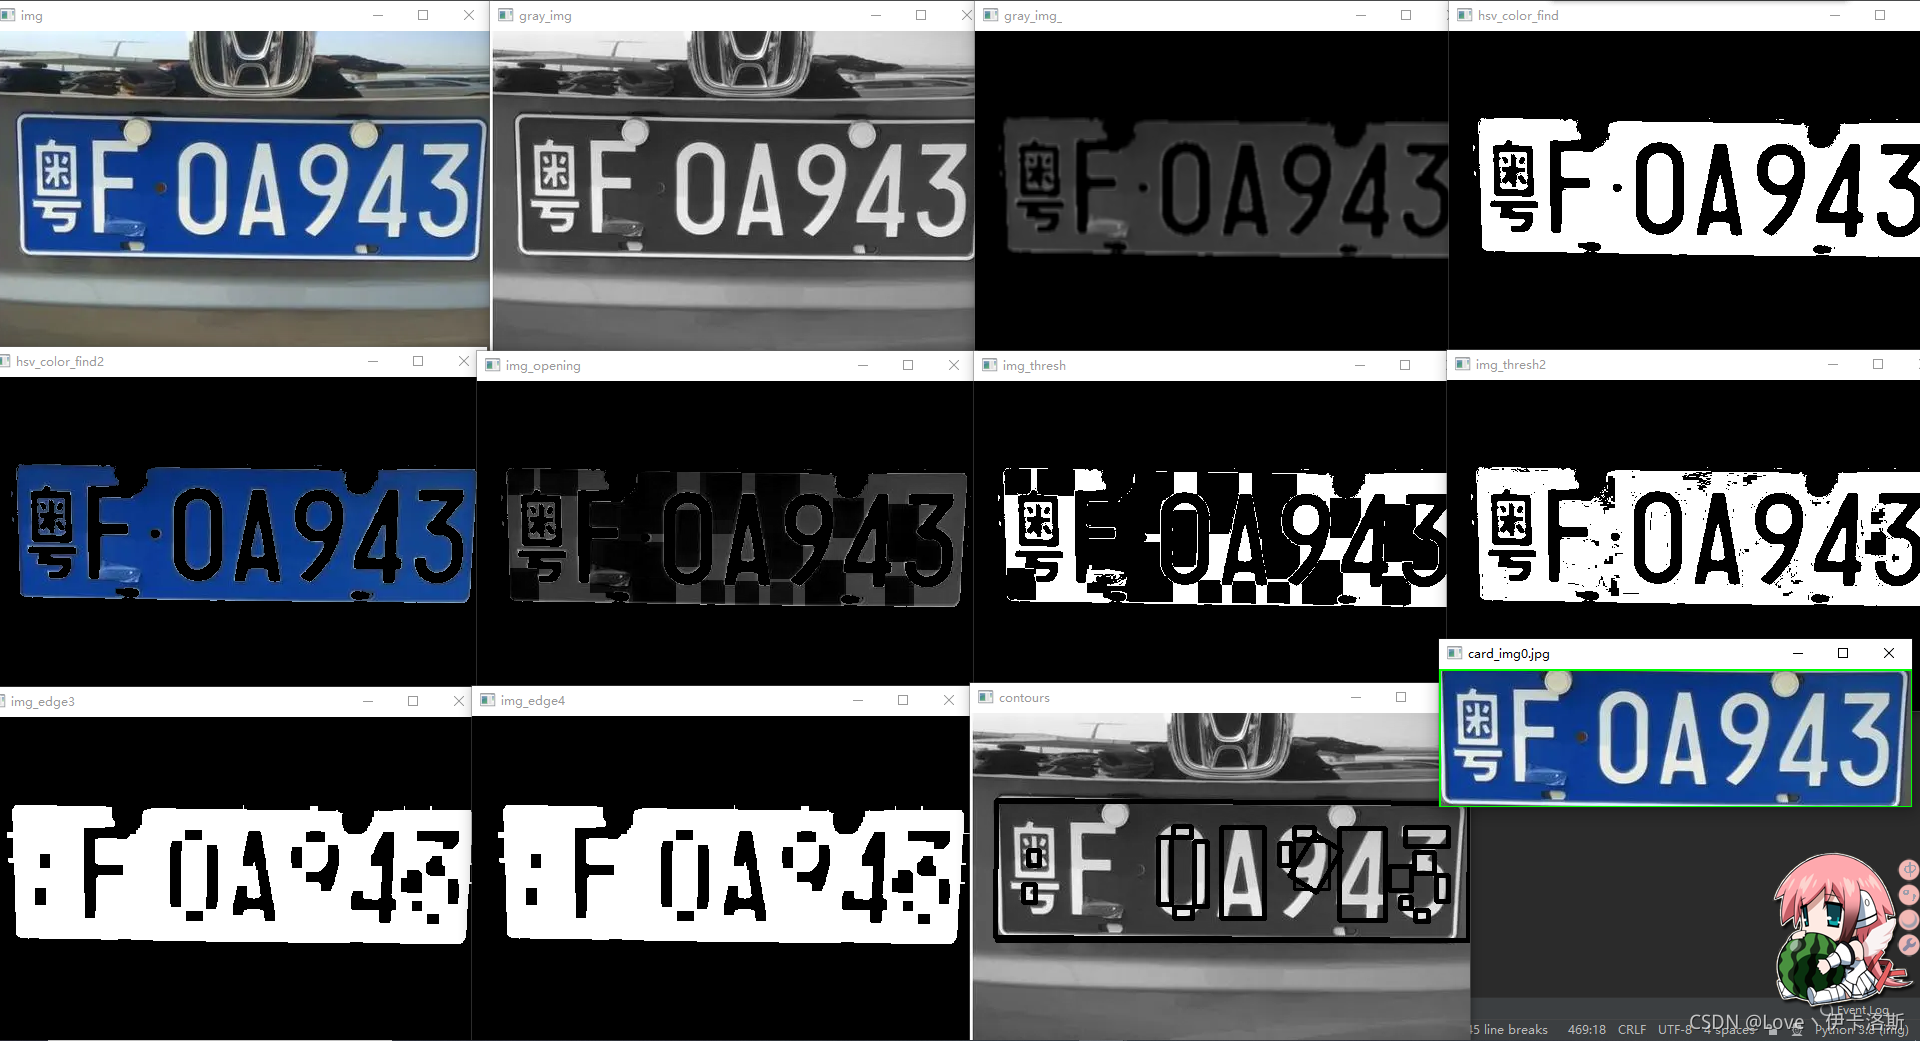
效果图
简易流程图

源码
import cv2
import numpy as np
import matplotlib.pyplot as plt
import os
import time
import sklearn
# import pytesseract
# 开发环境 pycharm python-3.8.5 opencv-python-4.5.4.58 matplotlib-3.5.0 pip-21.2.3 Tesseract-OCR-5.0.0
# 参考:https://blog.csdn.net/weixin_41695564/article/details/79712393
# 该函数能够读取磁盘中的图片文件,默认以彩色图像的方式进行读取
def imread_photo(filename, flags=cv2.IMREAD_COLOR):
"""
该函数能够读取磁盘中的图片文件,默认以彩色图像的方式进行读取
输入: filename 指的图像文件名(可以包括路径)
flags用来表示按照什么方式读取图片,有以下选择(默认采用彩色图像的方式):
IMREAD_COLOR 彩色图像
IMREAD_GRAYSCALE 灰度图像
IMREAD_ANYCOLOR 任意图像
输出: 返回图片的通道矩阵
"""
return cv2.imread(filename, flags)
# 等比缩放 参考:https://blog.csdn.net/JulyLi2019/article/details/120720752
def resize_keep_aspectratio(image_src, dst_size):
src_h, src_w = image_src.shape[:2]
# print(src_h, src_w)
dst_h, dst_w = dst_size
# 判断应该按哪个边做等比缩放
h = dst_w * (float(src_h) / src_w) # 按照w做等比缩放
w = dst_h * (float(src_w) / src_h) # 按照h做等比缩放
h = int(h)
w = int(w)
if h <= dst_h:
image_dst = cv2.resize(image_src, (dst_w, int(h)))
else:
image_dst = cv2.resize(image_src, (int(w), dst_h))
h_, w_ = image_dst.shape[:2]
# print(h_, w_)
print('等比缩放完毕')
return image_dst
# 这个函数的作用就是来调整图像的尺寸大小,当输入图像尺寸的宽度大于阈值(默认1000),我们会将图像按比例缩小
def resize_photo(imgArr, MAX_WIDTH=1000):
"""
这个函数的作用就是来调整图像的尺寸大小,当输入图像尺寸的宽度大于阈值(默认1000),我们会将图像按比例缩小
输入: imgArr是输入的图像数字矩阵
输出: 经过调整后的图像数字矩阵
拓展:OpenCV自带的cv2.resize()函数可以实现放大与缩小,函数声明如下:
cv2.resize(src, dsize[, dst[, fx[, fy[, interpolation]]]]) → dst
其参数解释如下:
src 输入图像矩阵
dsize 二元元祖(宽,高),即输出图像的大小
dst 输出图像矩阵
fx 在水平方向上缩放比例,默认值为0
fy 在垂直方向上缩放比例,默认值为0
interpolation 插值法,如INTER_NEAREST,INTER_LINEAR,INTER_AREA,INTER_CUBIC,INTER_LANCZOS4等
"""
img = imgArr
rows, cols = img.shape[:2] # 获取输入图像的高和宽
# 如果宽度大于设定的阈值
if cols > MAX_WIDTH:
change_rate = MAX_WIDTH / cols
img = cv2.resize(img, (MAX_WIDTH, int(rows * change_rate)), interpolation=cv2.INTER_AREA)
return img
# hsv提取蓝色部分
def hsv_color_find(img):
img_copy = img.copy()
"""
提取图中的蓝色部分 hsv范围可以自行优化
"""
hsv = cv2.cvtColor(img_copy, cv2.COLOR_BGR2HSV)
low_hsv = np.array([100, 80, 80])
high_hsv = np.array([124, 255, 255])
# 设置HSV的阈值
mask = cv2.inRange(hsv, lowerb=low_hsv, upperb=high_hsv)
cv2.imshow("hsv_color_find", mask)
# 将掩膜与图像层逐像素相加
res = cv2.bitwise_and(img_copy, img_copy, mask=mask)
cv2.imshow("hsv_color_find2", res)
print('hsv提取蓝色部分完毕')
return res
# 找到可能是车牌的一些矩形区域
def predict(imageArr):
"""
这个函数通过一系列的处理,找到可能是车牌的一些矩形区域
输入: imageArr是原始图像的数字矩阵
输出:gray_img_原始图像经过高斯平滑后的二值图
contours是找到的多个轮廓
"""
img_copy = imageArr.copy()
img_copy = hsv_color_find(img_copy)
# RGB->灰度
gray_img = cv2.cvtColor(img_copy, cv2.COLOR_BGR2GRAY)
# 该函数将源图像转换为指定的高斯核。支持就地过滤。
gray_img_ = cv2.GaussianBlur(gray_img, (5, 5), 0, 0, cv2.BORDER_DEFAULT)
kernel = np.ones((23, 23), np.uint8)
# 使用侵蚀和膨胀作为基本操作来执行高级形态转换。任何操作都可以就地完成.在多通道图像的情况下,每个通道都是独立处理的.
img_opening = cv2.morphologyEx(gray_img, cv2.MORPH_OPEN, kernel)
# 计算两个数组的加权和
img_opening = cv2.addWeighted(gray_img, 1, img_opening, -1, 0)
cv2.imshow("img_opening", img_opening)
# 该函数将固定电平阈值应用于多通道阵列.该函数通常用于从灰度图像中获取双级(二进制)图像(比较也可用于此目的)或消除噪声,即滤除值过小或过大的像素。
ret, img_thresh = cv2.threshold(img_opening, 0, 255, cv2.THRESH_BINARY + cv2.THRESH_OTSU)
ret2, img_thresh2 = cv2.threshold(img_opening, 0, 255, cv2.THRESH_BINARY)
cv2.imshow("img_thresh", img_thresh)
cv2.imshow("img_thresh2", img_thresh2)
# 该函数在输入图像中查找边缘,并使用Canny算法在输出映射边缘进行标记。阈值1和阈值2之间的最小值用于边缘连接。最大值用于寻找强边的初始段。
img_edge = cv2.Canny(img_thresh, 100, 200)
# cv2.imshow("img_edge", img_edge)
# # 使用开运算和闭运算让图像边缘成为一个整体
# kernel = np.ones((10, 10), np.uint8)
# 30*30 矩形 其大小需要根据 车牌在图片中宽度的占比和图片像素进行转换, 简测下来大概是 ( 宽占比 * 原图宽像素 / 10 ) 例 0.6 * 500 / 10 = 30
kernel = cv2.getStructuringElement(cv2.MORPH_RECT, (10, 10))
img_edge1 = cv2.morphologyEx(img_edge, cv2.MORPH_CLOSE, kernel)
img_edge2 = cv2.morphologyEx(img_edge1, cv2.MORPH_OPEN, kernel)
img_edge3 = cv2.morphologyEx(img_thresh2, cv2.MORPH_CLOSE, kernel)
img_edge4 = cv2.morphologyEx(img_edge3, cv2.MORPH_CLOSE, kernel)
# img_edge1 = cv2.morphologyEx(img_edge2, cv2.MORPH_CLOSE, kernel)
# img_edge2 = cv2.morphologyEx(img_edge1, cv2.MORPH_OPEN, kernel)
# cv2.imshow("img_edge1", img_edge1)
# cv2.imshow("img_edge2", img_edge2)
cv2.imshow("img_edge3", img_edge3)
cv2.imshow("img_edge4", img_edge4)
# 查找图像边缘整体形成的矩形区域,可能有很多,车牌就在其中一个矩形区域中
contours, hierarchy = cv2.findContours(img_edge2, cv2.RETR_TREE, cv2.CHAIN_APPROX_SIMPLE)
contours2, hierarchy2 = cv2.findContours(img_edge4, cv2.RETR_TREE, cv2.CHAIN_APPROX_SIMPLE)
# print("hierarchy:")
# print(hierarchy)
print('可能是车牌的一些矩形区域提取完毕')
return gray_img_, contours, contours2
# 根据findContours返回的contours 画出轮廓
def draw_contours(img, contours):
for c in contours:
x, y, w, h = cv2.boundingRect(c)
"""
传入一个轮廓图像,返回 x y 是左上角的点, w和h是矩形边框的宽度和高度
"""
cv2.rectangle(img, (x, y), (x + w, y + h), (0, 255, 0), 2)
"""
画出矩形
img 是要画出轮廓的原图
(x, y) 是左上角点的坐标
(x+w, y+h) 是右下角的坐标
0,255,0)是画线对应的rgb颜色
2 是画出线的宽度
"""
# 获得最小的矩形轮廓 可能带旋转角度
rect = cv2.minAreaRect(c)
# 计算最小区域的坐标
box = cv2.boxPoints(rect)
# 坐标规范化为整数
box = np.int0(box)
# 画出轮廓
cv2.drawContours(img, [box], 0, (0, 255, 0), 3)
cv2.imshow("contours", img)
# 根据车牌的一些物理特征(面积等)对所得的矩形进行过滤
def chose_licence_plate(contours, Min_Area=2000):
"""
这个函数根据车牌的一些物理特征(面积等)对所得的矩形进行过滤
输入:contours是一个包含多个轮廓的列表,其中列表中的每一个元素是一个N*1*2的三维数组
输出:返回经过过滤后的轮廓集合
拓展:
(1) OpenCV自带的cv2.contourArea()函数可以实现计算点集(轮廓)所围区域的面积,函数声明如下:
contourArea(contour[, oriented]) -> retval
其中参数解释如下:
contour代表输入点集,此点集形式是一个n*2的二维ndarray或者n*1*2的三维ndarray
retval 表示点集(轮廓)所围区域的面积
(2) OpenCV自带的cv2.minAreaRect()函数可以计算出点集的最小外包旋转矩形,函数声明如下:
minAreaRect(points) -> retval
其中参数解释如下:
points表示输入的点集,如果使用的是Opencv 2.X,则输入点集有两种形式:一是N*2的二维ndarray,其数据类型只能为 int32
或者float32, 即每一行代表一个点;二是N*1*2的三维ndarray,其数据类型只能为int32或者float32
retval是一个由三个元素组成的元组,依次代表旋转矩形的中心点坐标、尺寸和旋转角度(根据中心坐标、尺寸和旋转角度
可以确定一个旋转矩形)
(3) OpenCV自带的cv2.boxPoints()函数可以根据旋转矩形的中心的坐标、尺寸和旋转角度,计算出旋转矩形的四个顶点,函数声明如下:
boxPoints(box[, points]) -> points
其中参数解释如下:
box是旋转矩形的三个属性值,通常用一个元组表示,如((3.0,5.0),(8.0,4.0),-60)
points是返回的四个顶点,所返回的四个顶点是4行2列、数据类型为float32的ndarray,每一行代表一个顶点坐标
"""
temp_contours = []
for contour in contours:
if cv2.contourArea(contour) > Min_Area:
temp_contours.append(contour)
car_plate1 = []
car_plate2 = []
car_plate3 = []
for temp_contour in temp_contours:
rect_tupple = cv2.minAreaRect(temp_contour)
rect_width, rect_height = rect_tupple[1]
if rect_width < rect_height:
rect_width, rect_height = rect_height, rect_width
aspect_ratio = rect_width / rect_height
# 中国:蓝牌和黑牌是440×140,黄牌前牌尺寸同,后牌为440×220;摩托车及轻便摩托车前牌是220×95,后牌是220×140。
# 车牌正常情况下宽高比在2 - 3.15之间 稍微放宽点范围
if aspect_ratio > 1.5 and aspect_ratio < 4.65:
car_plate1.append(temp_contour)
rect_vertices = cv2.boxPoints(rect_tupple)
rect_vertices = np.int0(rect_vertices)
# print(temp_contour)
print('一次筛查后,符合比例的矩形有' + str(len(car_plate1)) + '个')
# 二次筛查 如果符合尺寸的矩形大于1,则缩小宽高比
if len(car_plate1) > 1:
for temp_contour in car_plate1:
rect_tupple = cv2.minAreaRect(temp_contour)
rect_width, rect_height = rect_tupple[1]
if rect_width < rect_height:
rect_width, rect_height = rect_height, rect_width
aspect_ratio = rect_width / rect_height
# 中国:蓝牌和黑牌是440×140,黄牌前牌尺寸同,后牌为440×220;摩托车及轻便摩托车前牌是220×95,后牌是220×140。
# 车牌正常情况下宽高比在2 - 3.15之间 稍微放宽点范围
if aspect_ratio > 1.6 and aspect_ratio < 4.15:
car_plate2.append(temp_contour)
rect_vertices = cv2.boxPoints(rect_tupple)
rect_vertices = np.int0(rect_vertices)
print('二次筛查后,符合比例的矩形还有' + str(len(car_plate2)) + '个')
# 三次筛查 如果符合尺寸的矩形大于1,则缩小宽高比
if len(car_plate2) > 1:
for temp_contour in car_plate2:
rect_tupple = cv2.minAreaRect(temp_contour)
rect_width, rect_height = rect_tupple[1]
if rect_width < rect_height:
rect_width, rect_height = rect_height, rect_width
aspect_ratio = rect_width / rect_height
# 中国:蓝牌和黑牌是440×140,黄牌前牌尺寸同,后牌为440×220;摩托车及轻便摩托车前牌是220×95,后牌是220×140。
# 车牌正常情况下宽高比在2 - 3.15之间 稍微放宽点范围
if aspect_ratio > 1.8 and aspect_ratio < 3.35:
car_plate3.append(temp_contour)
rect_vertices = cv2.boxPoints(rect_tupple)
rect_vertices = np.int0(rect_vertices)
print('三次筛查后,符合比例的矩形还有' + str(len(car_plate3)) + '个')
if len(car_plate3) > 0:
return car_plate3
if len(car_plate2) > 0:
return car_plate2
return car_plate1
# 根据得到的车牌定位,将车牌从原始图像中截取出来,并存在指定目录中。
def license_segment(car_plates, out_path):
"""
此函数根据得到的车牌定位,将车牌从原始图像中截取出来,并存在指定目录中。
输入: car_plates是经过初步筛选之后的车牌轮廓的点集
输出: out_path是车牌的存储路径
"""
i = 0
if len(car_plates) == 1:
for car_plate in car_plates:
row_min, col_min = np.min(car_plate[:, 0, :], axis=0)
row_max, col_max = np.max(car_plate[:, 0, :], axis=0)
cv2.rectangle(img, (row_min, col_min), (row_max, col_max), (0, 255, 0), 2)
card_img = img[col_min:col_max, row_min:row_max, :]
cv2.imwrite(out_path + "/card_img" + str(i) + ".jpg", card_img)
cv2.imshow("card_img" + str(i) + ".jpg", card_img)
i += 1
cv2.waitKey(0)
cv2.destroyAllWindows()
print('共切出' + str(i) + '张车牌图。')
return out_path + "/card_img0.jpg"
# 根据设定的阈值和图片直方图,找出波峰,用于分隔字符
def find_waves(threshold, histogram):
up_point = -1 # 上升点
is_peak = False
if histogram[0] > threshold:
up_point = 0
is_peak = True
wave_peaks = []
for i, x in enumerate(histogram):
if is_peak and x < threshold:
if i - up_point > 2:
is_peak = False
wave_peaks.append((up_point, i))
elif not is_peak and x >= threshold:
is_peak = True
up_point = i
if is_peak and up_point != -1 and i - up_point > 4:
wave_peaks.append((up_point, i))
return wave_peaks
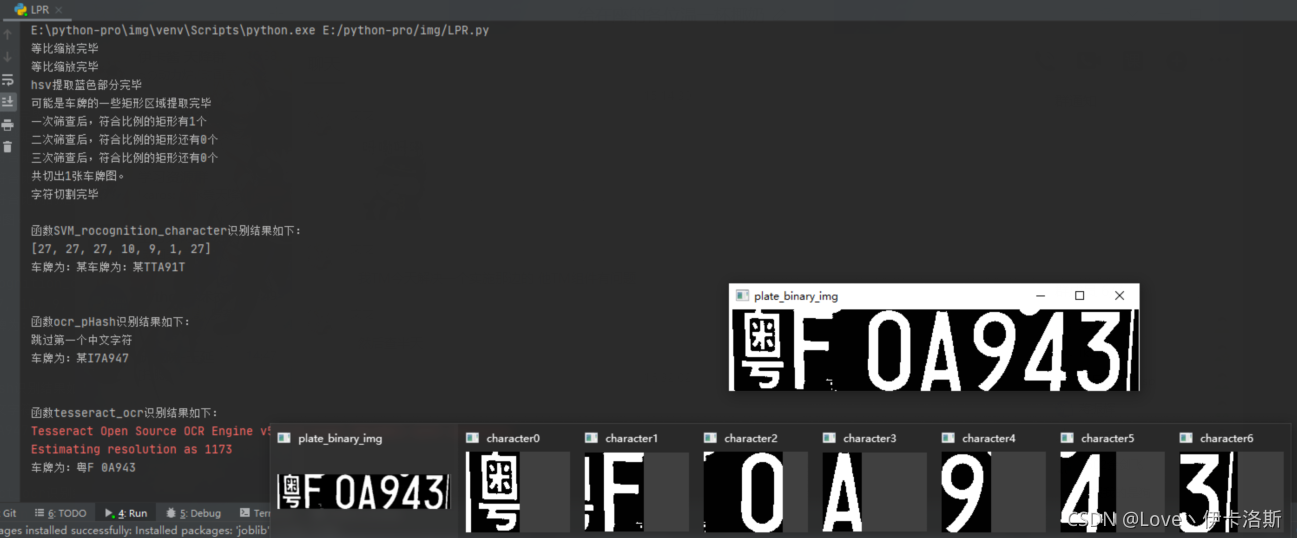
# 将截取到的车牌照片转化为灰度图,然后去除车牌的上下无用的边缘部分,确定上下边框
def remove_plate_upanddown_border(card_img):
"""
这个函数将截取到的车牌照片转化为灰度图,然后去除车牌的上下无用的边缘部分,确定上下边框
输入: card_img是从原始图片中分割出的车牌照片
输出: 在高度上缩小后的字符二值图片
"""
plate_Arr = cv2.imread(card_img)
plate_gray_Arr = cv2.cvtColor(plate_Arr, cv2.COLOR_BGR2GRAY)
ret, plate_binary_img = cv2.threshold(plate_gray_Arr, 0, 255, cv2.THRESH_BINARY + cv2.THRESH_OTSU)
row_histogram = np.sum(plate_binary_img, axis=1) # 数组的每一行求和
row_min = np.min(row_histogram)
row_average = np.sum(row_histogram) / plate_binary_img.shape[0]
row_threshold = (row_min + row_average) / 2
wave_peaks = find_waves(row_threshold, row_histogram)
# 接下来挑选跨度最大的波峰
wave_span = 0.0
for wave_peak in wave_peaks:
span = wave_peak[1] - wave_peak[0]
if span > wave_span:
wave_span = span
selected_wave = wave_peak
plate_binary_img = plate_binary_img[selected_wave[0]:selected_wave[1], :]
cv2.imshow("plate_binary_img", plate_binary_img)
return plate_binary_img
##################################################
# 测试用
# print( row_histogram )
# fig = plt.figure()
# plt.hist( row_histogram )
# plt.show()
# 其中row_histogram是一个列表,列表当中的每一个元素是车牌二值图像每一行的灰度值之和,列表的长度等于二值图像的高度
# 认为在高度方向,跨度最大的波峰为车牌区域
# cv2.imshow("plate_gray_Arr", plate_binary_img[selected_wave[0]:selected_wave[1], :])
##################################################
#####################二分-K均值聚类算法############################
def distEclud(vecA, vecB):
"""
计算两个坐标向量之间的街区距离
"""
return np.sum(abs(vecA - vecB))
def randCent(dataSet, k):
n = dataSet.shape[1] # 列数
centroids = np.zeros((k, n)) # 用来保存k个类的质心
for j in range(n):
minJ = np.min(dataSet[:, j], axis=0)
rangeJ = float(np.max(dataSet[:, j])) - minJ
for i in range(k):
centroids[i:, j] = minJ + rangeJ * (i + 1) / k
return centroids
def kMeans(dataSet, k, distMeas=distEclud, createCent=randCent):
m = dataSet.shape[0]
clusterAssment = np.zeros((m, 2)) # 这个簇分配结果矩阵包含两列,一列记录簇索引值,第二列存储误差。这里的误差是指当前点到簇质心的街区距离
centroids = createCent(dataSet, k)
clusterChanged = True
while clusterChanged:
clusterChanged = False
for i in range(m):
minDist = np.inf
minIndex = -1
for j in range(k):
distJI = distMeas(centroids[j, :], dataSet[i, :])
if distJI < minDist:
minDist = distJI
minIndex = j
if clusterAssment[i, 0]


