欢迎大家加入我的社区:http://t.csdn.cn/Q52km
社区中不定时发红包
文章目录
- 1、安装
- 2、在vue中引入(全局引入)
- 3、在vue中的使用
- 4、模板代码放在哪个位置
- 5、完整的一个vue页面实例:
- 6、实现效果
- 7、可能遇到的问题,下载不成功。使用
- 8、11:25-32 "export 'default' (imported as 'echarts') was not found in 'echarts
1、安装
npm install echarts --save
2、在vue中引入(全局引入)
// 引入echarts
import echarts from 'echarts'
Vue.prototype.$echarts = echarts
3、在vue中的使用
需要用到echart的地方先设置一个div的id、宽高
提示:
可以在一个页面中引入多个数据报表模板
使用div进行位置的排版放置
4、模板代码放在哪个位置
重点注意:其中const option = { }就是我们需要引进echart图表的代码
<template>
  <div>
    <div ref="chart" style="width:50%;height:376px"></div>
  </div>

</template>
要在mounted生命周期函数中实例化echarts对象。确保dom元素已经挂载到页面中。
mounted(){
    this.getEchartData()
    },


   methods: {
    getEchartData() {
      const chart = this.$refs.chart
      if (chart) {
        const myChart = this.$echarts.init(chart)
        const option = {...}
        myChart.setOption(option)
        window.addEventListener("resize", function() {
          myChart.resize()
        })
      }
       this.$on('hook:destroyed',()=>{
         window.removeEventListener("resize", function() {
          myChart.resize();
        });
        })
    }
  }
5、完整的一个vue页面实例:
<template>
  <div>
    <div ref="chart" style="width:50%;height:376px"></div>
    <div ref="chart1" style="width:50%;height:376px"></div>
  </div>

</template>

<script>

  export default {
    data() {

    },
    mounted() {
      this.getEchartData()
      this.getEchartData1()

    },
    methods: {
      getEchartData() {
        const chart = this.$refs.chart
        if (chart) {
          const myChart = this.$echarts.init(chart)
          const option = { legend: {},
            tooltip: {},
            dataset: {
              source: [

                ['订单', 43.3, 85.8],
                ['订单1', 83.1, 73.4],
                ['订单2', 86.4, 65.2],
                ['订单3', 72.4, 53.9],
                ['订单4', 82.4, 53.9],
                ['订单5', 42.4, 53.9],
                ['订单6', 72.4, 53.9],
                ['订单7', 72.4, 53.9]
              ]
            },
            xAxis: { type: 'category' },
            yAxis: {},

            series: [ { type: 'bar' }, { type: 'bar' }]}
          myChart.setOption(option)
          window.addEventListener("resize", function() {
            myChart.resize()
          })
        }
        this.$on('hook:destroyed',()=>{
          window.removeEventListener("resize", function() {
            myChart.resize();
          });
        })
      },
      getEchartData1() {
        const chart1 = this.$refs.chart1
        if (chart1) {
          const myChart = this.$echarts.init(chart1)
          const option = {
            title: {
              text: 'Stacked Line'
            },
            tooltip: {
              trigger: 'axis'
            },
            legend: {
              data: ['Email', 'Union Ads', 'Video Ads', 'Direct', 'Search Engine']
            },
            grid: {
              left: '3%',
              right: '4%',
              bottom: '3%',
              containLabel: true
            },
            toolbox: {
              feature: {
                saveAsImage: {}
              }
            },
            xAxis: {
              type: 'category',
              boundaryGap: false,
              data: ['一月', '二月', '三月', '四月', '五月', '六月', '七月','八月','九月','十月','十一月','十二月']
            },
            yAxis: {
              type: 'value'
            },
            series: [
              {
                name: 'Email',
                type: 'line',
                stack: 'Total',
                data: [120, 132, 101, 134, 90, 230, 210,120, 132, 101, 134, 90, 230]
              },
              {
                name: 'Union Ads',
                type: 'line',
                stack: 'Total',
                data: [220, 182, 191, 234, 290, 330, 310,220, 182, 191, 234, 290, 330]
              },
              {
                name: 'Video Ads',
                type: 'line',
                stack: 'Total',
                data: [150, 232, 201, 154, 190, 330, 410,150, 232, 201, 154, 190, 330]
              },
              {
                name: 'Direct',
                type: 'line',
                stack: 'Total',
                data: [320, 332, 301, 334, 390, 330, 320,320, 332, 301, 334, 390, 330]
              },
              {
                name: 'Search Engine',
                type: 'line',
                stack: 'Total',
                data: [820, 932, 901, 934, 1290, 1330, 1320,820, 932, 901, 934, 1290, 1330]
              }
            ]

          }
          myChart.setOption(option)
          window.addEventListener("resize", function() {
            myChart.resize()
          })
        }
        this.$on('hook:destroyed',()=>{
          window.removeEventListener("resize", function() {
            myChart.resize();
          });
        })
      },


    },
    watch: {},
    created() {
    }
  }
</script>
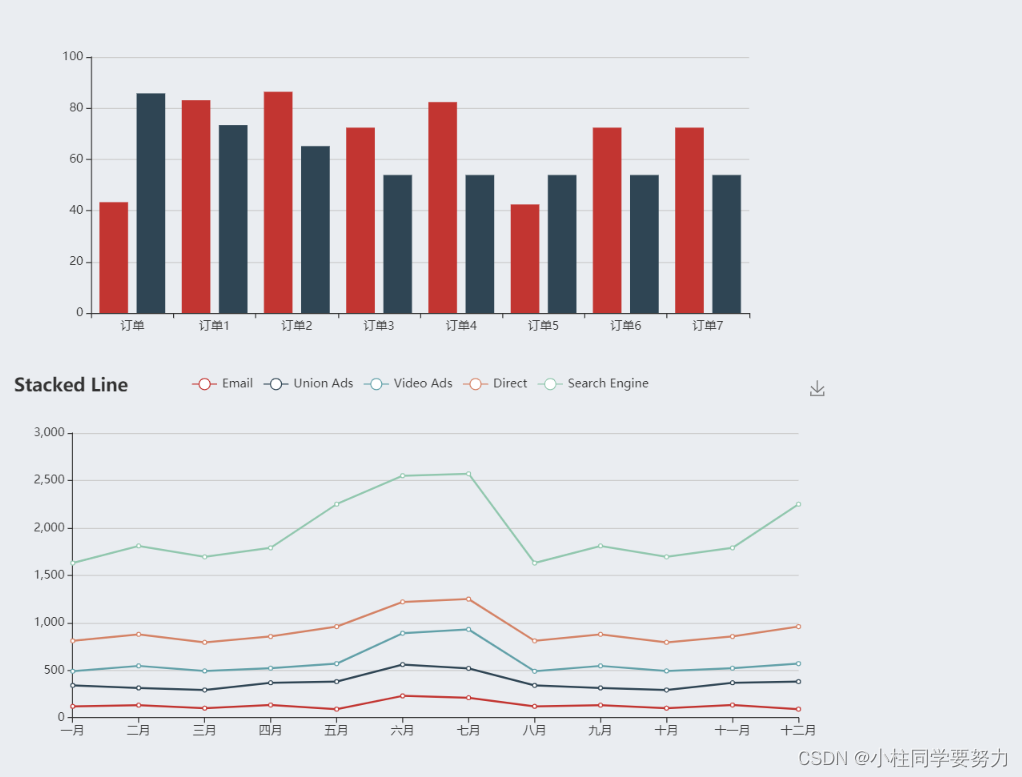
6、实现效果
7、可能遇到的问题,下载不成功。使用
cnpm install echarts --save

8、11:25-32 "export ‘default’ (imported as ‘echarts’) was not found in 'echarts
修改引入的方式
// 引入echarts
import *as echarts from 'echarts'
Vue.prototype.$echarts = echarts